Stream is one of the main sections of Realtime, which holds all notifications.
Notifications are generated by checking data in the past. For example, how many engagements came in the story on average after publications of some story or how many previews we generated on a story in the last 30 minutes.
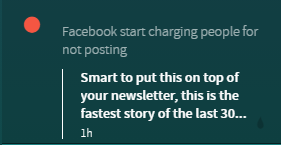
Notifications are divided into two types: Updates and Acts.
Updates are a standard notification, it is showing you info on how well your story is performing.
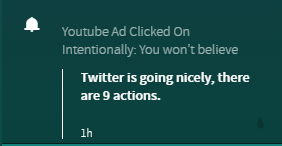
Acts are notifications that recommend some action that editors can take to optimize the story.
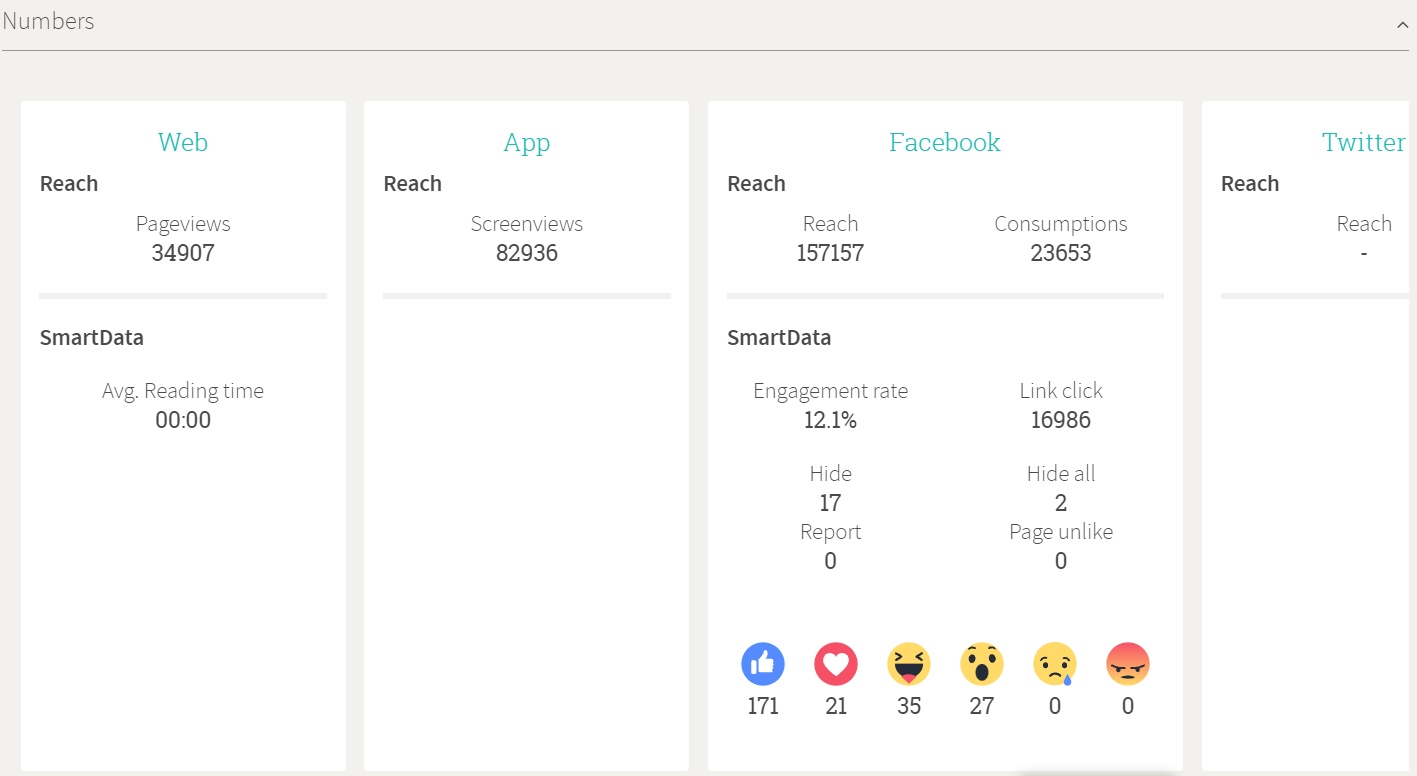
Clicking on the notification you can see more details about that article. Article updates and acts regarding that article info are divided into 5 sections: Reach, Social Actions, Stream, Story Value Engine, and Numbers.
The Reach section shows how well your article is getting to your readers. It is further divided into Pageviews, Origins, and Details.
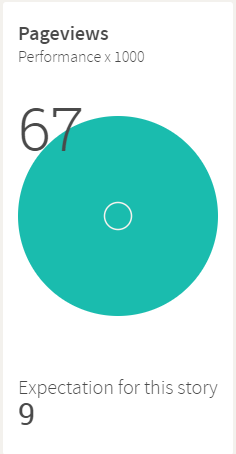
Pageviews show how many times your article has been read. Performance is multiplied by 1000, which means in this case that there are 67000 pageviews. Notice that there are two circles in pageviews. The green circle represents the number of page views and white circles represent expectations for this article, in this case, 9000.
Origins and Details show where your page views are coming from and at which period. In the Details, section performance is multiplied by 100.
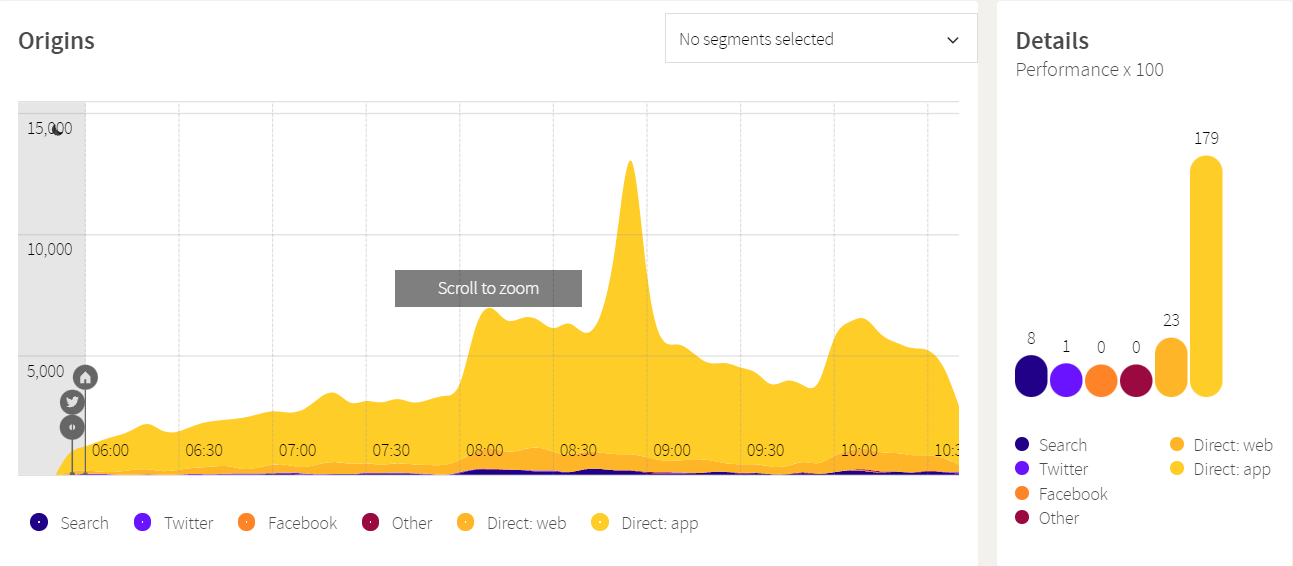
Small grey icons on the bottom represent where the article is published. Point icon shows publication time, the Twitter icon for Twitter, Home icon for Home page, Play button for a video on the article, and F icon for Facebook. You will receive some notifications base on this, in this example, you will receive notifications article is getting a lot of Facebook traffic but it isn’t posted on it, and later in the period when the article is added on Facebook, you will see an F icon appearing on the section.

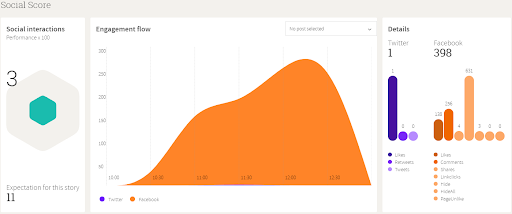
The Social score works in a similar way as the Reach section.
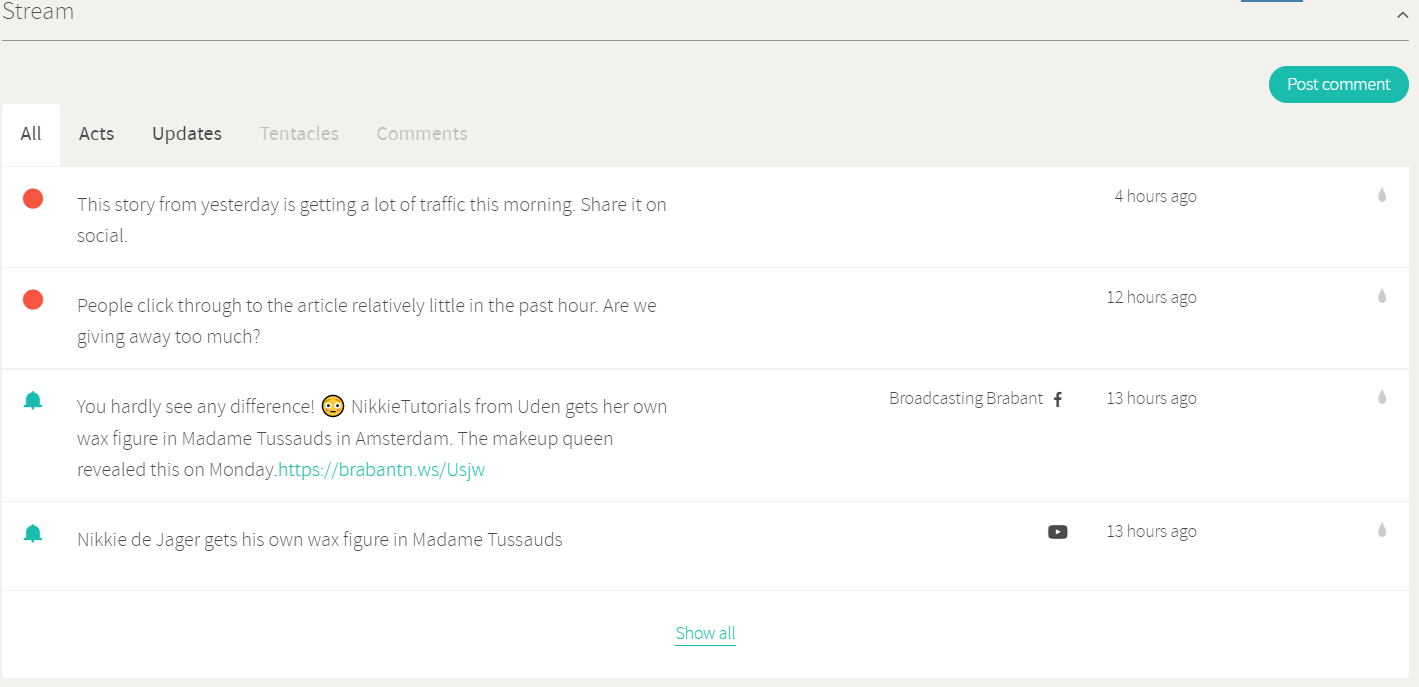
The Stream shows a list of all notifications and acts regarding that article. On the right side, you can see where it is posted, and if you click on for example Facebook icon, it will lead you to the Facebook post of that article.
Story Value Engine is showing Predictions and Conversions. Predictions show how big the reach will be based on the author and the section. Conversions work on the same principle if you have a subscription system.

Numbers show more detailed information for example average reading time or likes on Facebook, etc.