In Logbook - Current you can see the graphs of your data.
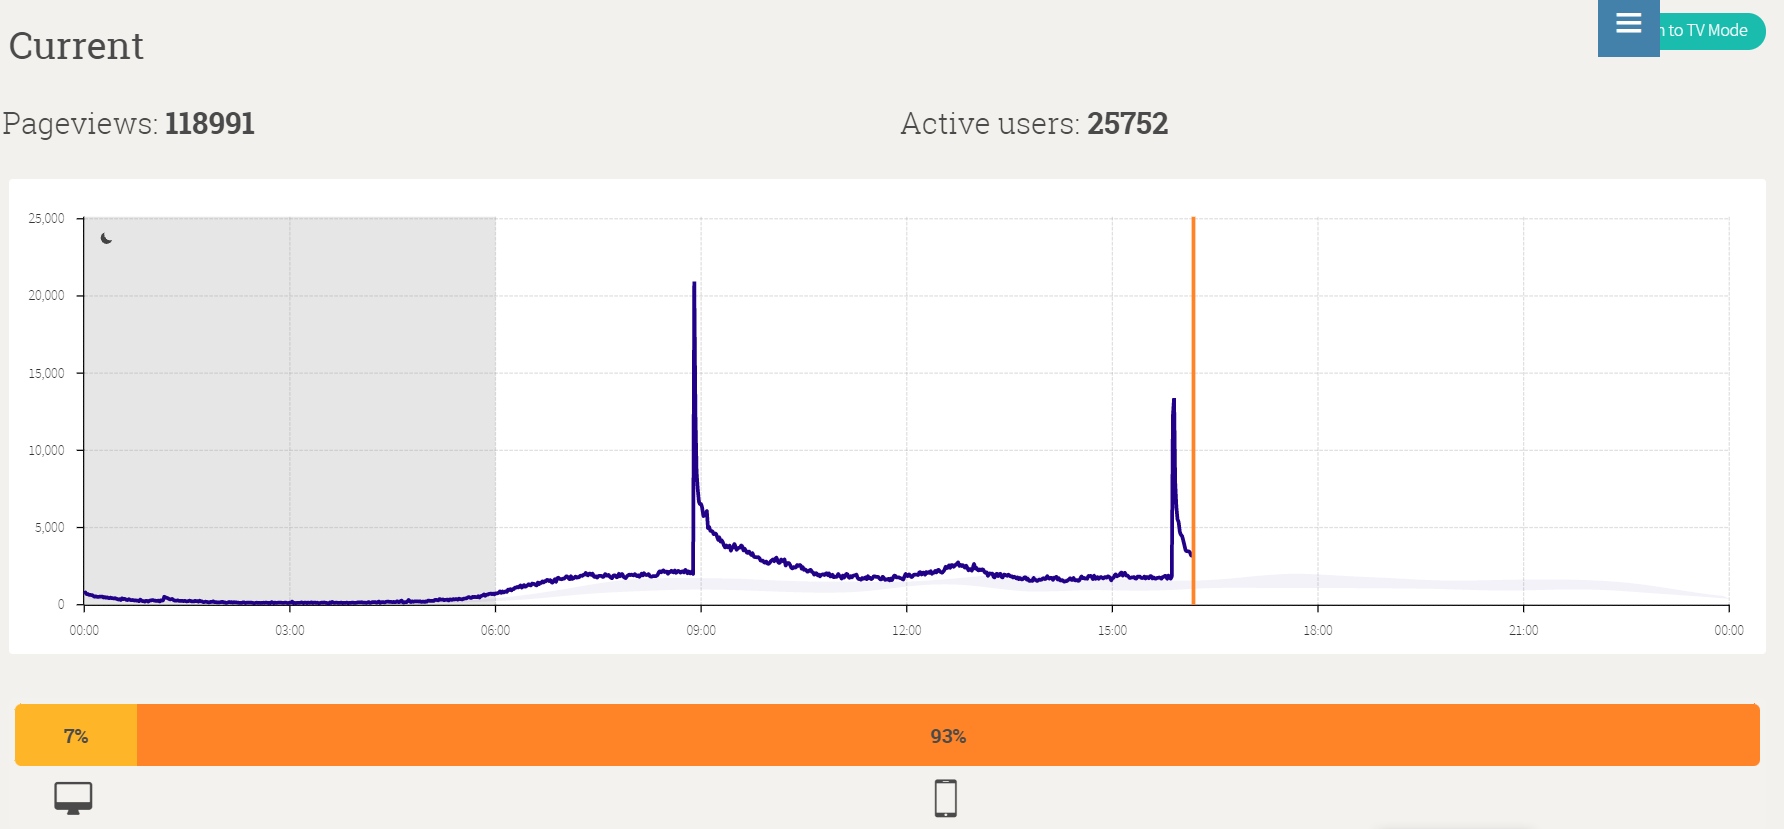
On the graph below you can see the number of page views and the number of current active users. You can also see the percentage of users on PC and Phone.
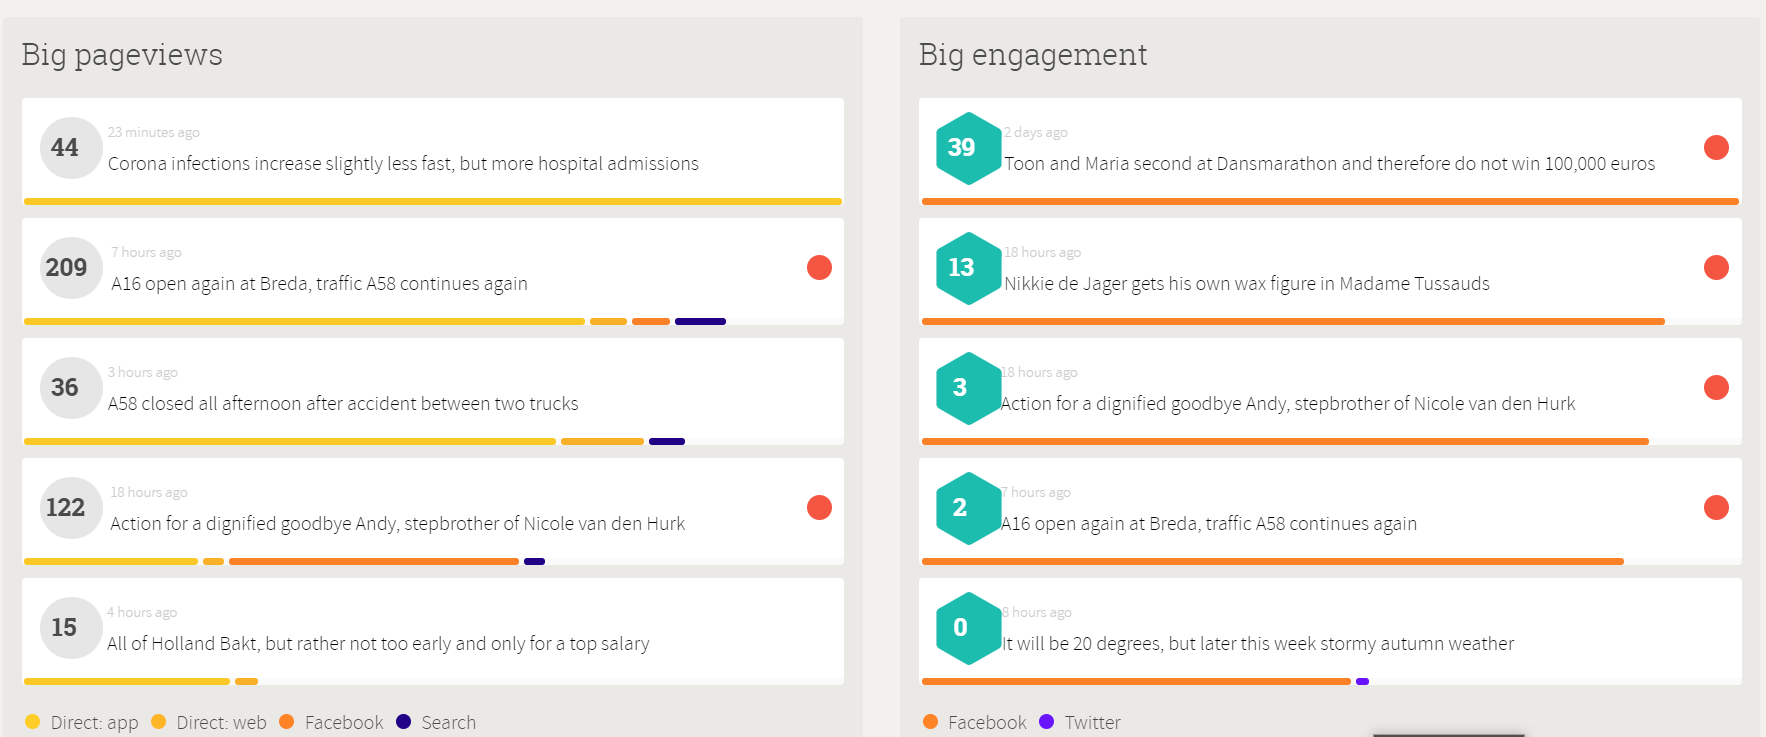
Below that graph, you can see Big Pageviews and Big Engagements.
Big Pageviews and Engagement shows the stories that have the most data in past 30 min. If there is a red circle next to the story, that means that story has some kind of action you can take. Clicking on the red circle, you will access the story. You will also see where are they gathering data from (example: Direct: app and web, Facebook, Twitter, etc.)
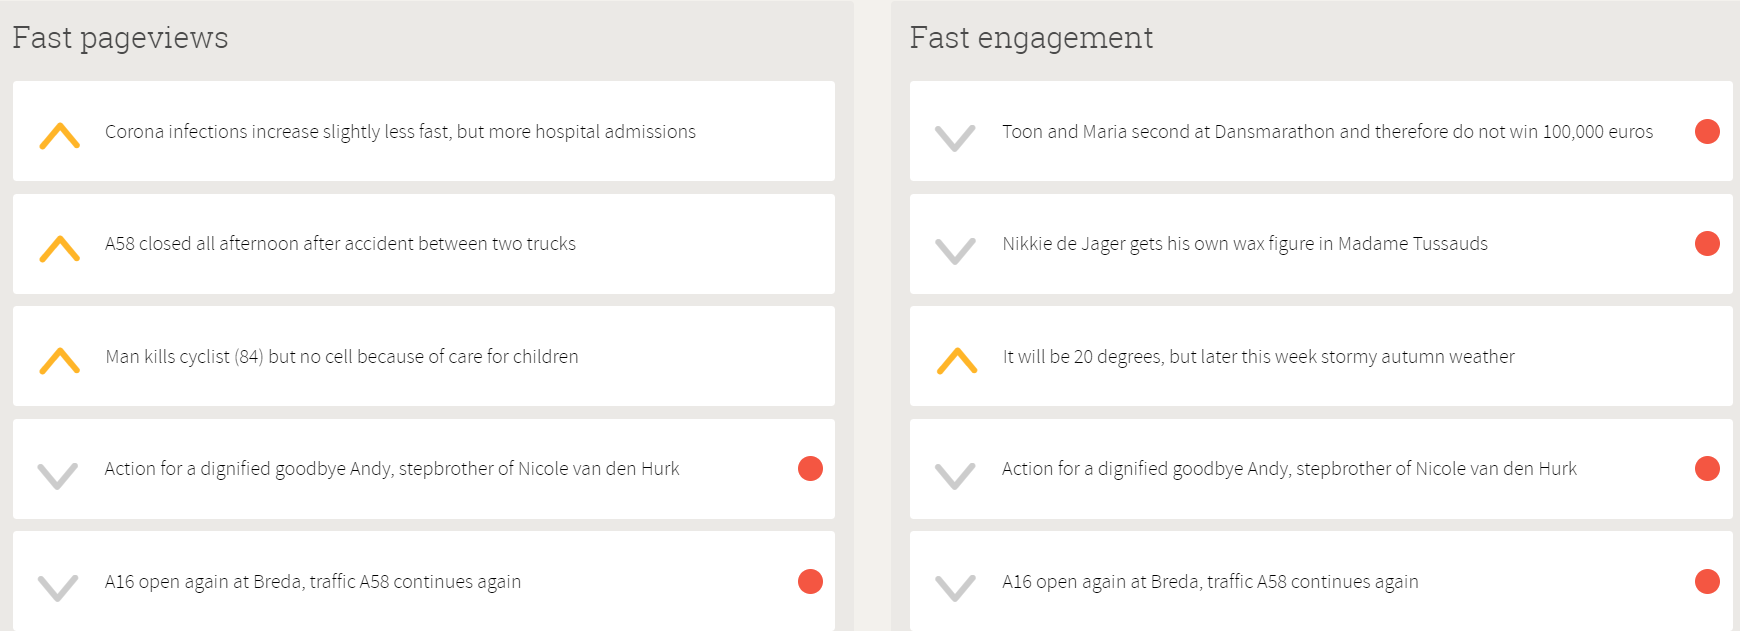
Below Big pageviews and engagement, you will see Fast pageviews and Fast engagement. They show the newest stories. If stories have the orange arrow next to them it means that they are trending. Grey arrow means that stories are falling out of the trend. As with Big pageviews and engagement, if there is a red circle next to the story, there is an action you can take. Clicking on the red circle, you will access the story.


